Time to First Token · Grok 4
0ms
Time to First Token · o3
7185ms
Deep dive into reasoning, benchmarks, and latency insights.
The current catalog does not contain complete performance evidence for both models, so this page does not declare an overall winner. Use the available fields as comparison signals and validate the models on your own workload.
Key decision metrics at a glance.
| Model | Metric | Value | Unit | Source / snapshot |
|---|---|---|---|---|
| Grok 4 | Reasoning | 9.0 | benchmark or capability score | Artificial Analysis · current catalog |
| o3 | Reasoning | 9.0 | benchmark or capability score | Artificial Analysis · current catalog |
| Grok 4 | Coding | 6.0 | benchmark or capability score | Artificial Analysis · current catalog |
| o3 | Coding | 6.0 | benchmark or capability score | Artificial Analysis · current catalog |
| Grok 4 | Multimodal | 3.0 | benchmark or capability score | Artificial Analysis · current catalog |
| o3 | Multimodal | 3.0 | benchmark or capability score | Artificial Analysis · current catalog |
| Grok 4 | Long Context | 4.0 | benchmark or capability score | Artificial Analysis · current catalog |
| o3 | Long Context | 4.0 | benchmark or capability score | Artificial Analysis · current catalog |
| Grok 4 | Blended Price / 1M tokens | $6 | USD per 1M tokens | Artificial Analysis · current catalog |
| o3 | Blended Price / 1M tokens | $3.5 | USD per 1M tokens | Artificial Analysis · current catalog |
| Grok 4 | P95 Latency | — | milliseconds | Artificial Analysis · current catalog |
| o3 | P95 Latency | — | milliseconds | Artificial Analysis · current catalog |
| Grok 4 | Tokens per second | 0 | tokens per second | Artificial Analysis · current catalog |
| o3 | Tokens per second | 119.185 | tokens per second | Artificial Analysis · current catalog |
Data provided by Artificial Analysis; live values use the current catalog.
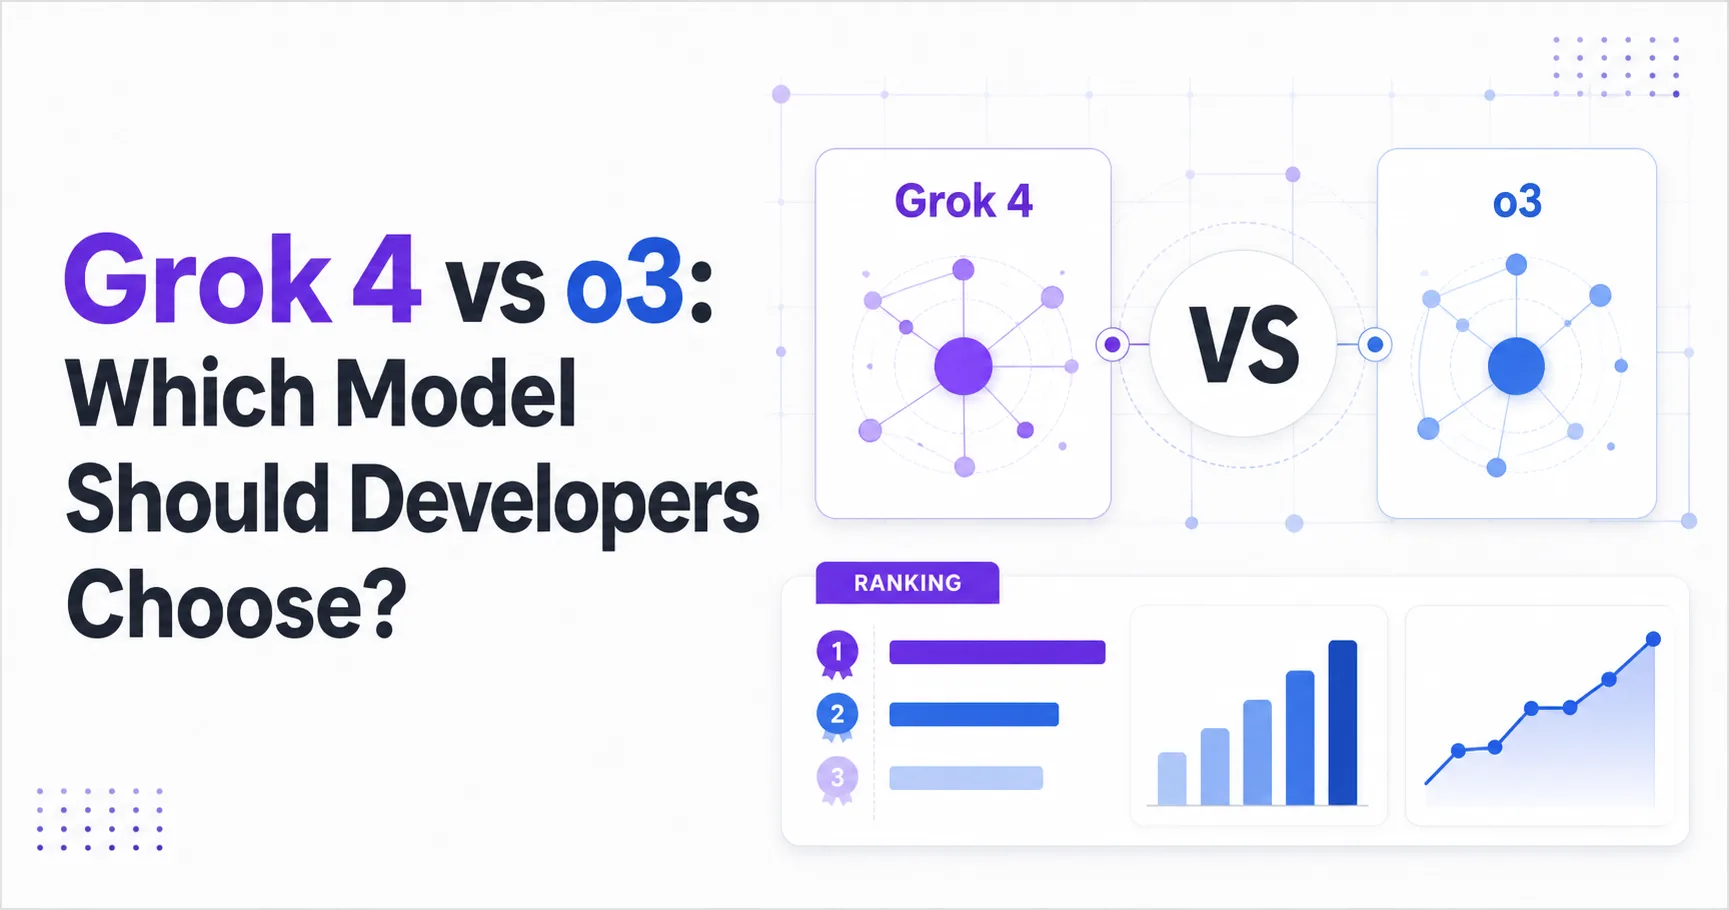
This radar chart visually maps the core capabilities (reasoning, coding, math proxy, multimodal, long context) of `Grok 4` vs `o3`.
This grouped bar chart provides a side-by-side comparison for each benchmark metric.
Lower time to first token is better; higher tokens per second is better.
Compare input and output pricing in USD per 1M tokens.
Grok 4$6.75
o3$4
o3 costs $2.75 less per run
This article is a dated snapshot published on 2026-08-07. Live cards above use the current catalog; missing live fields are not inferred.
Grok 4 is the stronger measured performer, while o3 is the clearer cost choice for developers who can verify access in their own environment. The supplied Artificial Analysis snapshot gives Grok 4 an Intelligence Index of 33.3 and a Math Index of 92.7, compared with 30.4 and 88.3 for o3. Those results make Grok 4 the better candidate for workloads where difficult reasoning and mathematical reliability dominate the selection decision. Data provided by Artificial Analysis
The commercial decision is less straightforward than the benchmark ranking. o3 costs $3.5 per 1M blended tokens under the supplied 3-to-1 input-output mix, while Grok 4 costs $6. o3 also has lower listed input and output prices. The latency measurement is tied at 0.3 seconds, and only o3 has a reported median output speed of 128.056 tokens per second. The speed comparison therefore supports o3, but the evidence is incomplete rather than symmetrical.
Developers should also separate measured capability from product certainty. The supplied research contains no reliable official, community, or failure-mode sources for Grok 4. For o3, the current OpenAI model directory does not list the model, and the supplied official pages do not establish its current endpoint, stable alias, context window, output limit, or multimodal support. Read this comparison as a decision framework based on the supplied snapshot, not as proof that either model is currently available for every API account.
Grok 4 offers the better measured quality profile, while o3 offers the lower operating cost and the only reported output-throughput figure. The benchmark gap is visible on both supplied evaluations. Grok 4 leads the Intelligence Index at 33.3 versus 30.4 for o3, and leads the Math Index at 92.7 versus 88.3. These are not interchangeable signals. The intelligence result is relevant to broad problem-solving comparisons, while the mathematics result is especially relevant to code involving formulas, symbolic reasoning, quantitative analysis, and verification-heavy tasks.
The practical meaning of the gap depends on error costs. A higher benchmark score does not guarantee better performance on a developer's exact prompts, repository conventions, tool calls, or production data. The supplied research does not include reproducible task-level tests, coding evaluations, or community reports for either model. Evidence is therefore insufficient to claim that Grok 4 will produce fewer defects in a specific software stack.
The cost advantage belongs to o3 across the listed dimensions. o3 is priced at $2 per 1M input tokens and $8 per 1M output tokens, compared with $3 and $15 for Grok 4. The blended comparison preserves the same direction, with o3 at $3.5 and Grok 4 at $6. That makes o3 attractive for high-volume workloads, provided the model can be called reliably and meets the application's quality threshold.
Availability is the largest unresolved variable. The supplied OpenAI model directory does not list o3 among the current catalog, and the supplied OpenAI pricing page does not list o3 pricing modes. The data snapshot still provides prices, but the research does not explain whether those prices are currently obtainable, account-dependent, or tied to a specific access path.
Grok 4 is the measured performance winner, but the available evidence cannot show how the score gap behaves inside real software workflows. Grok 4 leads o3 by 33.3 to 30.4 on the Artificial Analysis Intelligence Index. The mathematics result is further apart, with Grok 4 at 92.7 and o3 at 88.3. A developer choosing between them should treat the second result as the more decision-relevant signal for proof generation, algorithm design, quantitative debugging, and code that must preserve mathematical constraints.
The scores do not identify the tasks responsible for the difference. The supplied data does not provide prompt sets, sample sizes, confidence intervals, grader definitions, or per-task breakdowns. The supplied research also contains no verified Reddit, Hacker News, or X posts that could add real-world evidence about coding quality, response consistency, or failure patterns. Evidence is insufficient to convert the benchmark lead into a guaranteed production advantage.
Latency does not separate the models in the supplied snapshot. Both Grok 4 and o3 are listed at 0.3 seconds, so interactive responsiveness should not decide the choice on this evidence alone. o3 has a reported median output speed of 128.056 tokens per second, while Grok 4 has no reported value. That makes o3 the only model with a measurable throughput signal, but it does not prove that o3 finishes an entire developer task sooner. Output length, reasoning behavior, retries, tool calls, and application-side orchestration can change total completion time.
For evaluation, developers should test the exact workflow that matters: repository-level edits, structured output, tool use, long-context retrieval, and refusal or recovery behavior. The supplied materials do not establish context windows or output limits for either model, so long-document and agentic conclusions remain unverified.
Grok 4 leads on 2 of 2 metrics
o3 is the lower-cost option on every supplied token-price measure, but its economic advantage depends on acceptable quality and dependable access. The blended comparison places o3 at $3.5 per 1M tokens and Grok 4 at $6. Input pricing favors o3 at $2 versus $3, while output pricing favors o3 at $8 versus $15. The output difference matters more for verbose reasoning, code generation, and agent workflows that produce substantial responses.
The chart makes the price ranking clear; the harder question is whether lower unit cost lowers total system cost. A cheaper model can become more expensive when weaker answers require extra validation, retries, human review, or a second model pass. Grok 4's higher Math Index may justify its price in tasks where a wrong calculation creates expensive downstream work. The supplied materials do not measure retry rates, defect rates, review time, or cost per successful task, so no total-cost winner can be established.
The blended price also depends on the supplied 3-to-1 input-output mix. Applications with mostly short outputs may experience a smaller practical difference than applications that generate long code, explanations, or tool instructions. Applications with output-heavy workloads should pay closer attention to the listed output prices, because Grok 4 is priced at $15 per 1M output tokens compared with $8 for o3.
Availability creates another cost risk. The supplied OpenAI pricing page does not list o3, and the supplied model directory does not list it in the current catalog. The research does not confirm whether the snapshot price is currently actionable. Grok 4 has no verified pricing source in the supplied research, so its Artificial Analysis price should be treated as the comparison input, not as a confirmed vendor quotation. Developers should validate billing, quotas, and access before committing to either model.
o3 leads on 3 of 3 metrics
Grok 4 is the better first choice for quality-sensitive reasoning and mathematics workloads, while o3 is the better first choice for cost-sensitive workloads with verified access. Grok 4's supplied scores lead on both measured evaluations, including a Math Index of 92.7. That profile fits systems where correctness is more valuable than minimizing token spend, such as quantitative analysis, complex planning, and difficult debugging.
Choose o3 when the application processes enough traffic for token economics to dominate and the model passes a task-specific acceptance test. Its blended price is $3.5 per 1M tokens, and its output price is $8 per 1M tokens. The reported output speed of 128.056 tokens per second may also support streaming experiences, although the supplied evidence does not show end-to-end completion time.
Use Grok 4 as the safer benchmark-led candidate when the workflow contains mathematical reasoning or costly errors. Use o3 as the efficient candidate when prompts are routine, output volume is high, and the team can verify that the model is callable under the required account and endpoint. A routing design could reserve Grok 4 for difficult or high-risk tasks and send simpler work to o3, but the supplied materials do not provide enough evidence to estimate the benefit of that policy.
The unresolved o3 catalog status should affect procurement planning. The supplied OpenAI model directory does not list o3 and does not establish a stable alias or replacement path. The supplied research does not provide a comparable official source for Grok 4. Before launch, confirm endpoint availability, rate limits, model naming, context behavior, output limits, and billing in the intended deployment environment. Those facts are missing from the supplied research and cannot be inferred from benchmark scores.
o3 is cheaper on the supplied pricing snapshot, but developers still need to verify that the listed model is available through the intended OpenAI account and endpoint. The supplied official model directory does not list o3, while the supplied data snapshot lists o3 at $3.5 per 1M blended tokens. That discrepancy means the price comparison is useful for relative economics, but it is not sufficient evidence for procurement or deployment planning.
Grok 4 is the better benchmark-led choice for difficult reasoning because it scores 33.3 on the Artificial Analysis Intelligence Index, compared with 30.4 for o3. The supplied materials do not prove that this lead transfers to every coding or agent workflow.
Grok 4 is the stronger choice on the supplied mathematics evidence, with a Math Index of 92.7 versus 88.3 for o3. Developers should still run task-specific tests because the research provides no reproducible prompt set, grader details, or production failure data.
o3 is cheaper across the supplied pricing measures, including $3.5 versus $6 per 1M blended tokens, $2 versus $3 per 1M input tokens, and $8 versus $15 per 1M output tokens. Access must be verified before relying on those prices.
The supplied latency result is tied at 0.3 seconds for Grok 4 and o3, while only o3 has a reported median output speed of 128.056 tokens per second. The evidence is insufficient to establish lower end-to-end completion time for either model.
The supplied research cannot support a confident general deployment claim because the current OpenAI model directory does not list o3 and does not establish its stable alias, endpoint, context window, or output limit. Teams must verify access directly in their environment.
The supplied data gives Grok 4 higher intelligence and mathematics scores, but no verified coding studies, community tests, failure reports, or task-level production measurements. Grok 4 is therefore the measured quality leader, not a proven universal production winner.