
Time to First Token · MiMo-V2-Flash (Feb 2026)
0ms
Time to First Token · o3
7185ms
Deep dive into reasoning, benchmarks, and latency insights.
The current catalog does not contain complete performance evidence for both models, so this page does not declare an overall winner. Use the available fields as comparison signals and validate the models on your own workload.
Key decision metrics at a glance.
| Model | Metric | Value | Unit | Source / snapshot |
|---|---|---|---|---|
| MiMo-V2-Flash (Feb 2026) | Reasoning | 6.0 | benchmark or capability score | Artificial Analysis · current catalog |
| o3 | Reasoning | 9.0 | benchmark or capability score | Artificial Analysis · current catalog |
| MiMo-V2-Flash (Feb 2026) | Coding | 6.0 | benchmark or capability score | Artificial Analysis · current catalog |
| o3 | Coding | 6.0 | benchmark or capability score | Artificial Analysis · current catalog |
| MiMo-V2-Flash (Feb 2026) | Multimodal | 3.0 | benchmark or capability score | Artificial Analysis · current catalog |
| o3 | Multimodal | 3.0 | benchmark or capability score | Artificial Analysis · current catalog |
| MiMo-V2-Flash (Feb 2026) | Long Context | 4.0 | benchmark or capability score | Artificial Analysis · current catalog |
| o3 | Long Context | 4.0 | benchmark or capability score | Artificial Analysis · current catalog |
| MiMo-V2-Flash (Feb 2026) | Blended Price / 1M tokens | $0 | USD per 1M tokens | Artificial Analysis · current catalog |
| o3 | Blended Price / 1M tokens | $3.5 | USD per 1M tokens | Artificial Analysis · current catalog |
| MiMo-V2-Flash (Feb 2026) | P95 Latency | — | milliseconds | Artificial Analysis · current catalog |
| o3 | P95 Latency | — | milliseconds | Artificial Analysis · current catalog |
| MiMo-V2-Flash (Feb 2026) | Tokens per second | 0 | tokens per second | Artificial Analysis · current catalog |
| o3 | Tokens per second | 119.185 | tokens per second | Artificial Analysis · current catalog |
Data provided by Artificial Analysis; live values use the current catalog.
This radar chart visually maps the core capabilities (reasoning, coding, math proxy, multimodal, long context) of `MiMo-V2-Flash (Feb 2026)` vs `o3`.
This grouped bar chart provides a side-by-side comparison for each benchmark metric.
Lower time to first token is better; higher tokens per second is better.
Compare input and output pricing in USD per 1M tokens.
MiMo-V2-Flash (Feb 2026)$0
o3$4
MiMo-V2-Flash (Feb 2026) costs $4 less per run
This article is a dated snapshot published on 2026-08-07. Live cards above use the current catalog; missing live fields are not inferred.
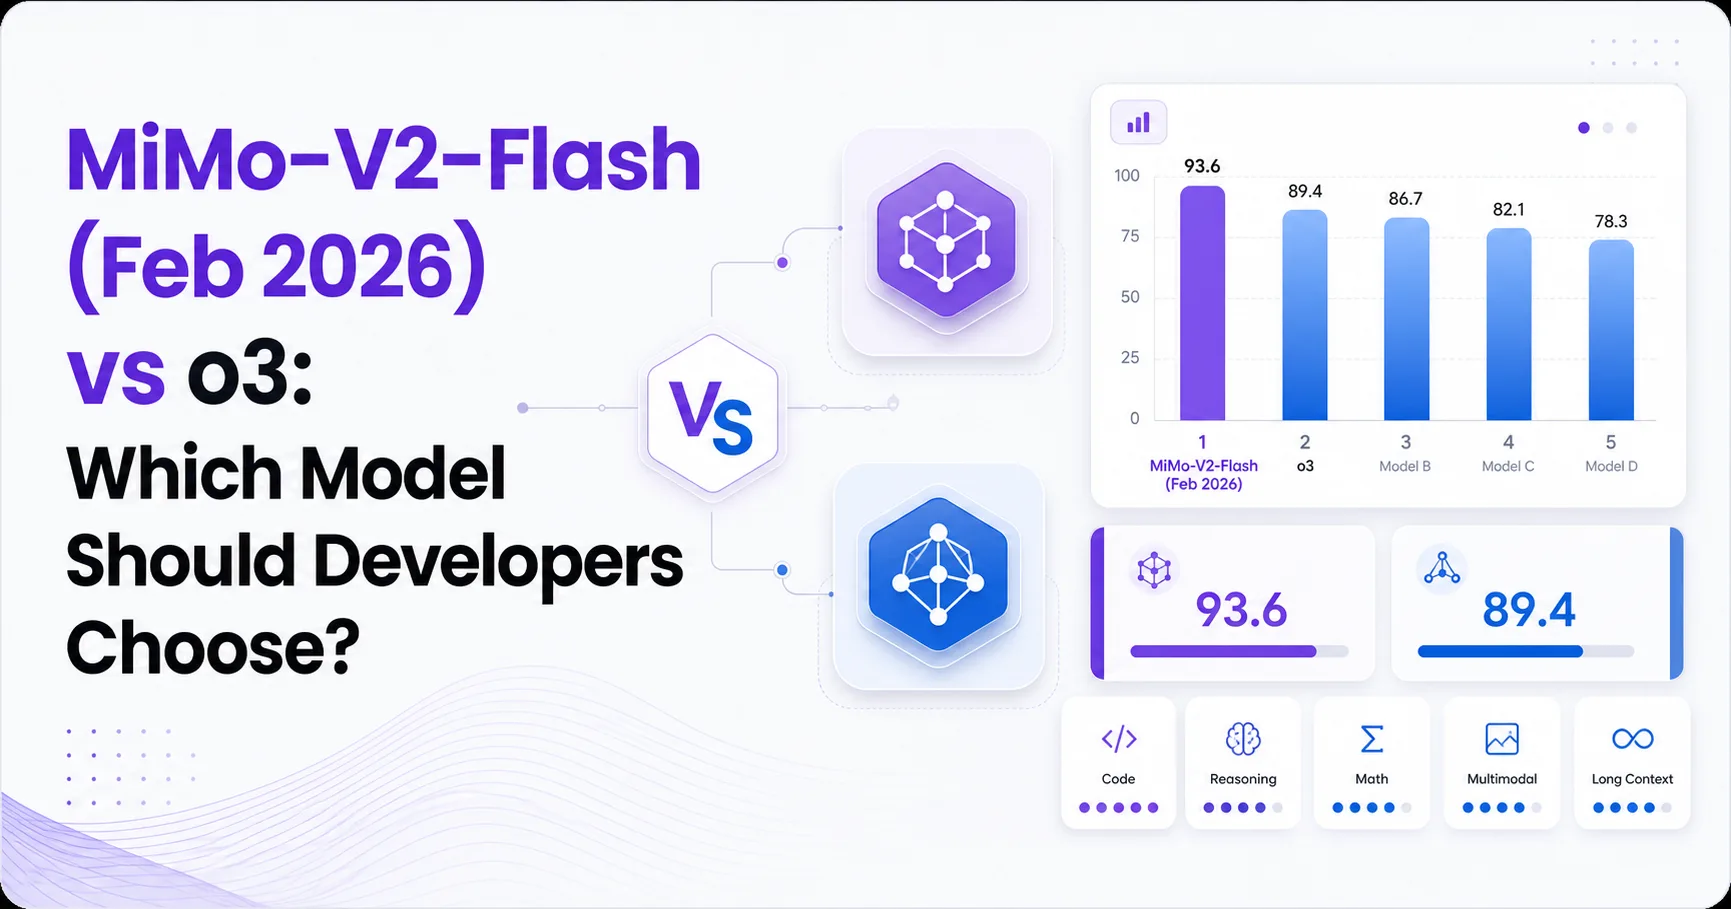
MiMo-V2-Flash (Feb 2026) leads the available general intelligence score, but o3 is the safer default for most developers because it costs less and has measured output-speed data.
The supplied data reports an Artificial Analysis Intelligence Index of 33.2 for MiMo-V2-Flash and 30.4 for o3. That difference gives MiMo-V2-Flash the narrow benchmark lead available in this comparison. The same dataset reports a blended price of $15 per 1M tokens for MiMo-V2-Flash and $3.5 for o3.
The evidence is asymmetric. MiMo-V2-Flash has no verified official announcement, developer documentation, pricing page, community testing, or documented failure cases in the research brief. OpenAI’s current model directory does not list o3, and its current pricing page does not provide an o3 price, even though the data brief supplies benchmark and pricing values. Developers should therefore treat this as a decision under incomplete product-status evidence.
Data provided by Artificial Analysis.
o3 is the stronger production candidate when cost, measured speed, and vendor traceability outweigh MiMo-V2-Flash’s benchmark advantage.
| Decision factor | MiMo-V2-Flash (Feb 2026) | o3 | Practical reading |
|---|---|---|---|
| Intelligence Index | 33.2 | 30.4 | MiMo-V2-Flash leads the supplied general score |
| Math Index | No value supplied | 88.3 | Only o3 has a reported mathematics result |
| Latency | 0.3 seconds | 0.3 seconds | The supplied latency result is tied |
| Median output speed | No value supplied | 128.056 tokens per second | o3 has the only reported throughput figure |
| Blended price | $15 per 1M tokens | $3.5 per 1M tokens | o3 is substantially cheaper in the supplied data |
The benchmark lead does not establish a universal quality lead. The research brief supplies no task breakdown, test methodology, confidence interval, or failure analysis for the Intelligence Index. It also supplies no comparable math result for MiMo-V2-Flash. The correct interpretation is that MiMo-V2-Flash has the higher reported score in one index, while o3 has broader evidence across the reported comparison fields.
The product-status picture is also important. The OpenAI model directory currently emphasizes GPT-5.6 models and does not list o3. The OpenAI pricing page does not list o3 pricing. Those pages do not prove that o3 cannot be called, but they do leave current availability, aliases, and replacement status unresolved.
o3 is the more measurable performance choice, while MiMo-V2-Flash remains the score leader only on the reported Intelligence Index.
The Intelligence Index result favors MiMo-V2-Flash at 33.2 versus 30.4 for o3. In a real application, that gap could matter if the benchmark reflects the exact work your system performs, such as broad reasoning, planning, or mixed knowledge tasks. The supplied evidence does not identify the benchmark’s task composition, so the score cannot tell a developer whether MiMo-V2-Flash will produce better code, fewer tool errors, or more reliable structured output.
o3 has a reported Math Index of 88.3, while no MiMo-V2-Flash value is supplied. That creates an evidence advantage for o3 in mathematically structured workloads, but it is not a head-to-head win because the competing result is missing. Developers should not convert the missing MiMo-V2-Flash value into a low score.
The latency result is 0.3 seconds for each model. That tie suggests that request startup may not separate the choices under the tested conditions. Output behavior is less comparable. o3 reports 128.056 median output tokens per second, while MiMo-V2-Flash has no supplied throughput value. A fast median can improve interactive experiences, but it does not reveal tail latency, time to first token, streaming stability, or response quality at a fixed budget.
The Artificial Analysis dataset supports the reported measurements, but the supplied brief does not include methodology details sufficient to predict production behavior. Load testing with representative prompts remains necessary.
o3 is the clear cost leader in the supplied pricing data, and its lower output price reduces the risk of expensive verbose responses.
The blended rate is $3.5 per 1M tokens for o3 versus $15 for MiMo-V2-Flash. Input pricing is $2 versus $10, and output pricing is $8 versus $30. These differences affect architecture decisions, especially for applications that process large documents, maintain long conversations, or generate substantial code and reports.
The price gap matters most when the models deliver comparable task success. A cheaper model can become more expensive operationally if it needs repeated retries, additional validation calls, more tool corrections, or a larger orchestration layer. The supplied evidence does not report success rates, retry rates, token usage by task, or quality-adjusted cost. No reliable conclusion can therefore be made about cost per accepted answer.
MiMo-V2-Flash could still justify its higher listed data rate if its Intelligence Index advantage maps closely to a high-value workflow. That case is unproven because the research brief contains no verified product positioning, no community testing, and no failure examples for MiMo-V2-Flash. o3’s reported Math Index and output-speed value make its cost case easier to evaluate, but OpenAI’s current pricing page does not independently confirm an o3 listing.
Use the Artificial Analysis data as a comparison input, then validate actual billing, availability, and token accounting through the endpoint you intend to deploy.
MiMo-V2-Flash (Feb 2026) leads on 3 of 3 metrics
o3 is the recommended starting point for production experiments because its price, speed, and reported math result provide the most actionable evidence.
Choose o3 for cost-sensitive APIs, interactive coding tools, mathematical workflows, and systems where measured throughput helps shape user experience. Its reported blended price is $3.5 per 1M tokens, its median output speed is 128.056 tokens per second, and its Math Index is 88.3. These values do not guarantee production quality, but they give a developer concrete signals to test.
Choose MiMo-V2-Flash when your evaluation set rewards the type of general intelligence represented by its 33.2 score and the added cost is acceptable. That recommendation requires a private acceptance test because the supplied research found no verified official documentation, stable alias, API endpoint, pricing page, or community failure analysis for the model.
Do not select either model solely from the benchmark headline. Start with prompts that reflect your application, then compare accepted-answer rate, tool-call correctness, structured-output validity, latency under concurrency, and total tokens per successful task. The supplied evidence does not provide these production metrics.
The official OpenAI pages add a deployment caveat. The current model directory does not list o3, while the current pricing page does not list an o3 price. Confirm that the intended o3 endpoint is available and supported before committing application architecture to it.
o3 is easier to justify from the supplied evidence, but developers still need endpoint and task-level validation before deployment.
The central unresolved issue is not the benchmark ranking. It is product certainty. MiMo-V2-Flash lacks verified product documentation in the research brief. o3 has official vendor documentation, but the current model directory and pricing page do not list it. That combination means the comparison can rank observed data while leaving operational availability uncertain.
A sound evaluation should preserve the distinction between measured values and missing values. A missing MiMo-V2-Flash speed result is not evidence of slow output. A missing MiMo-V2-Flash Math Index is not evidence of weak mathematical reasoning. Likewise, the absence of o3 from current pages does not by itself prove that every o3 endpoint is unavailable.
Use the Artificial Analysis source for the supplied comparative measurements and verify deployment details against the official OpenAI models documentation and OpenAI pricing documentation.
MiMo-V2-Flash (Feb 2026) has the higher supplied Intelligence Index at 33.2 versus 30.4 for o3, but that single result does not prove better production performance. o3 has the only supplied Math Index and output-speed measurements, while comparable task-level evidence is missing.
o3 is cheaper in every supplied pricing field: $3.5 per 1M blended tokens versus $15, $2 per 1M input tokens versus $10, and $8 per 1M output tokens versus $30. Actual cost per successful task remains unverified because quality and retry data are unavailable.
o3 has the only supplied output-speed measurement, at 128.056 median output tokens per second, so it is the more measurable choice for interactive applications. Reported latency is tied at 0.3 seconds, and no tail-latency or time-to-first-token evidence is supplied.
The supplied evidence does not establish current o3 deployment availability. OpenAI’s current model directory does not list o3, and its current pricing page does not list o3 pricing. Developers should verify the intended endpoint, alias, access policy, and billing behavior before committing to production.
The biggest risk is product uncertainty rather than a demonstrated capability failure. The research brief contains no verified official documentation, API endpoint, stable alias, pricing page, community testing, or documented failure scenario for MiMo-V2-Flash. Developers should require an acceptance test and deployment confirmation.