
Time to First Token · MiMo-V2.5
2031ms
Time to First Token · o3
7185ms
Deep dive into reasoning, benchmarks, and latency insights.
The current catalog does not contain complete performance evidence for both models, so this page does not declare an overall winner. Use the available fields as comparison signals and validate the models on your own workload.
Key decision metrics at a glance.
| Model | Metric | Value | Unit | Source / snapshot |
|---|---|---|---|---|
| MiMo-V2.5 | Reasoning | 6.0 | benchmark or capability score | Artificial Analysis · current catalog |
| o3 | Reasoning | 9.0 | benchmark or capability score | Artificial Analysis · current catalog |
| MiMo-V2.5 | Coding | 6.0 | benchmark or capability score | Artificial Analysis · current catalog |
| o3 | Coding | 6.0 | benchmark or capability score | Artificial Analysis · current catalog |
| MiMo-V2.5 | Multimodal | 3.0 | benchmark or capability score | Artificial Analysis · current catalog |
| o3 | Multimodal | 3.0 | benchmark or capability score | Artificial Analysis · current catalog |
| MiMo-V2.5 | Long Context | 5.0 | benchmark or capability score | Artificial Analysis · current catalog |
| o3 | Long Context | 4.0 | benchmark or capability score | Artificial Analysis · current catalog |
| MiMo-V2.5 | Blended Price / 1M tokens | $0.175 | USD per 1M tokens | Artificial Analysis · current catalog |
| o3 | Blended Price / 1M tokens | $3.5 | USD per 1M tokens | Artificial Analysis · current catalog |
| MiMo-V2.5 | P95 Latency | — | milliseconds | Artificial Analysis · current catalog |
| o3 | P95 Latency | — | milliseconds | Artificial Analysis · current catalog |
| MiMo-V2.5 | Tokens per second | 61.81 | tokens per second | Artificial Analysis · current catalog |
| o3 | Tokens per second | 119.185 | tokens per second | Artificial Analysis · current catalog |
Data provided by Artificial Analysis; live values use the current catalog.
This radar chart visually maps the core capabilities (reasoning, coding, math proxy, multimodal, long context) of `MiMo-V2.5` vs `o3`.
This grouped bar chart provides a side-by-side comparison for each benchmark metric.
Lower time to first token is better; higher tokens per second is better.
Compare input and output pricing in USD per 1M tokens.
MiMo-V2.5$0.21
o3$4
MiMo-V2.5 costs $3.79 less per run
This article is a dated snapshot published on 2026-08-07. Live cards above use the current catalog; missing live fields are not inferred.
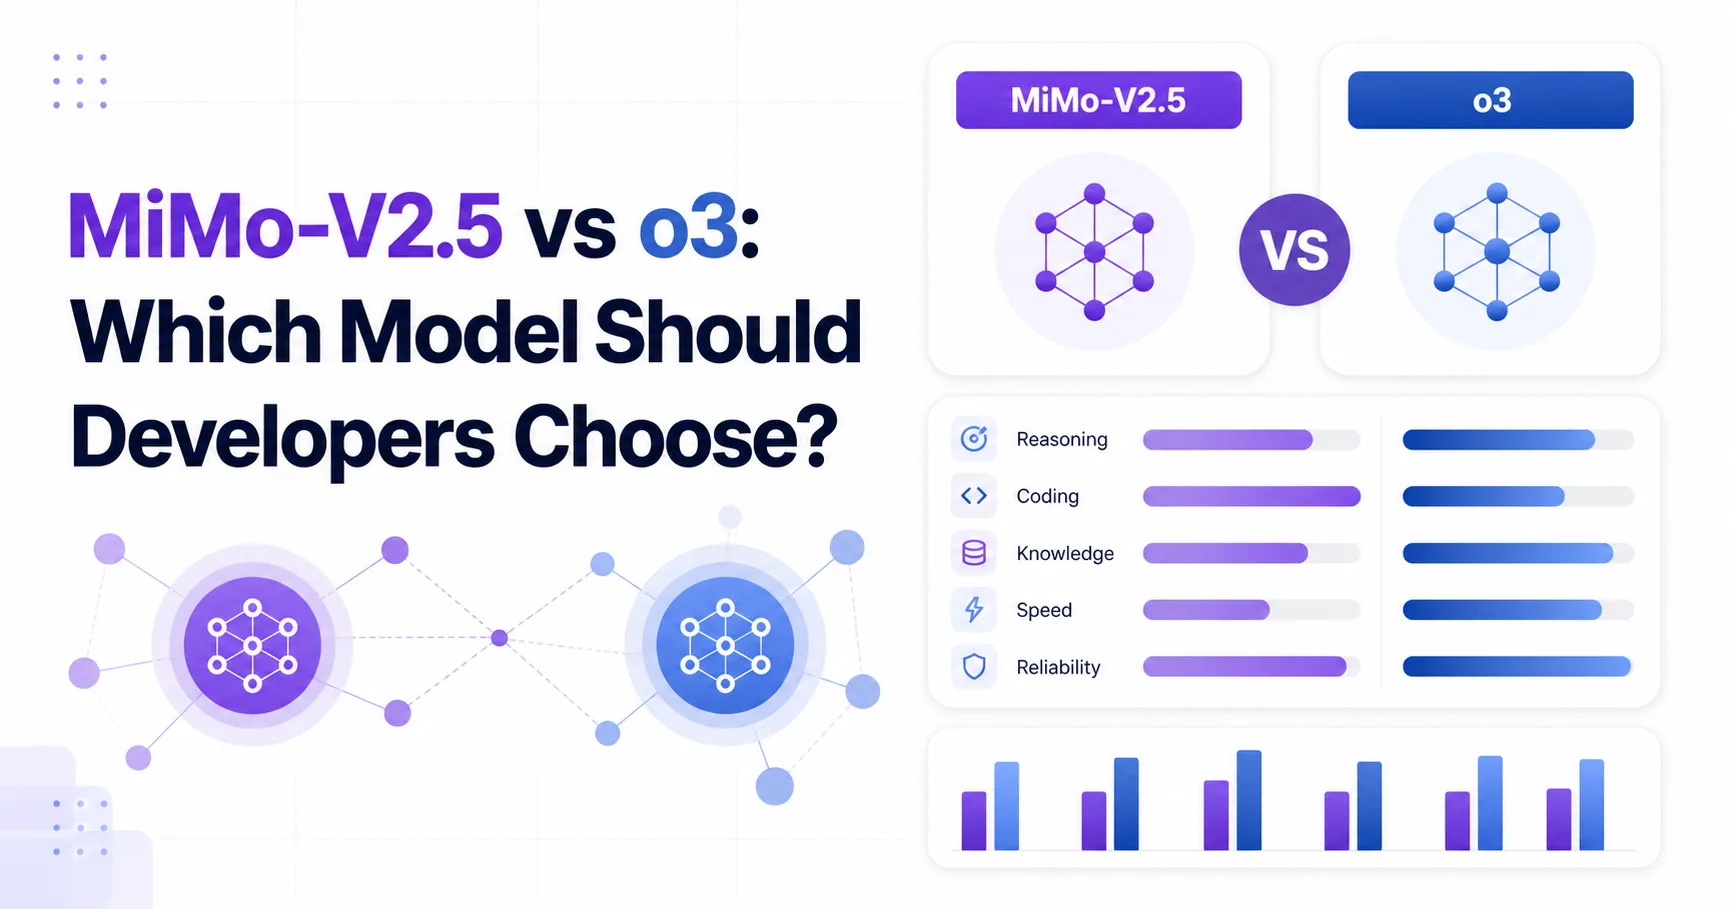
MiMo-V2.5 is the stronger default for cost-sensitive developer workloads, while o3 remains the faster option with a measured math score of 88.3. The comparison is unusually asymmetric because the supplied research verifies current OpenAI documentation pages but provides no verified official or community sources for MiMo-V2.5. The performance data comes from Artificial Analysis, and the evidence should therefore be read as a measured snapshot rather than a complete product-status assessment.
Developers choosing between these models should separate three decisions: measured capability, runtime economics, and procurement risk. MiMo-V2.5 leads the available general intelligence comparison at 37.2 versus 30.4 for o3. o3 leads output speed at 128.056 median output tokens per second versus 73.585. Both models show 0.3 seconds of measured latency, so faster generation does not automatically mean faster initial responses.
The central recommendation is practical: start with MiMo-V2.5 for high-volume generation, classification, agent steps, and other workloads where token cost dominates. Test o3 when mathematical reasoning or faster streaming output is more important than price. Treat both availability decisions cautiously because the supplied research does not establish a verified current endpoint for either model.
MiMo-V2.5 offers the better measured value profile, but o3 has the clearer evidence of a specialized mathematical advantage. The supplied data does not provide a coding score for o3, so the coding comparison cannot identify a winner. MiMo-V2.5 has a coding index of 56.8, but that number cannot be compared against a missing o3 result.
| Decision factor | MiMo-V2.5 | o3 | What it means |
|---|---|---|---|
| Artificial Analysis Intelligence Index | 37.2 | 30.4 | MiMo-V2.5 leads the available general capability measure |
| Artificial Analysis Coding Index | 56.8 | Not provided | Coding leadership is not established |
| Artificial Analysis Math Index | Not provided | 88.3 | o3 has the only supplied math result |
| Median output speed | 73.585 tokens per second | 128.056 tokens per second | o3 produces output faster after generation begins |
| Measured latency | 0.3 seconds | 0.3 seconds | The supplied latency result is tied |
| Blended price per 1M tokens | $0.175 | $3.5 | MiMo-V2.5 has the lower measured operating price |
The data is attributed to https://artificialanalysis.ai/. The model records contain no context-window value for either model, so prompt-size planning remains an evidence gap. The research also does not verify MiMo-V2.5 documentation, pricing pages, aliases, or community testing. For o3, OpenAI's current model directory does not list the model in the supplied research, and OpenAI's pricing page does not provide a current o3 price. That conflict between benchmark data and product-status evidence matters before production adoption.
o3 is the better choice when faster token emission or mathematical reasoning is the primary performance requirement. Its measured median output speed is 128.056 tokens per second, compared with 73.585 for MiMo-V2.5. That difference should matter most in interactive streaming interfaces, long answers, and workflows where users see generated text continuously.
The latency result changes the interpretation. Both models record 0.3 seconds, so o3's output-speed lead does not demonstrate a faster first response. A developer building a chat interface may feel little benefit if time to first token, queue behavior, or network delay dominates the interaction. The supplied data does not explain the test harness, request size, concurrency, streaming mode, or variance. It therefore supports a directional speed decision, not a universal production guarantee.
MiMo-V2.5 leads the available Artificial Analysis Intelligence Index at 37.2 versus 30.4 for o3. That result supports MiMo-V2.5 for broad task selection, but it does not prove superiority in every reasoning category. o3 has the only supplied math result, 88.3, while MiMo-V2.5 has no math value in the snapshot. The evidence therefore points to different strengths rather than a complete quality ranking.
Coding is even less settled. MiMo-V2.5 has a coding index of 56.8, but the o3 coding value is missing. Developers should not convert that asymmetry into a coding winner. The supplied research also contains no verified community tests, failure reports, or coding workflow evaluations for either model. Repository repair, tool calling, and long-horizon agent reliability remain open questions requiring local evaluation.
MiMo-V2.5 is the clear measured price winner, but workload architecture determines whether its lower token rate becomes a lower system cost. Its blended price is $0.175 per 1M tokens, compared with $3.5 for o3. Input pricing is $0.14 for MiMo-V2.5 and $2 for o3, while output pricing is $0.28 and $8 respectively. The largest practical exposure is output-heavy workflows because generated tokens carry the higher o3 price.
A cheaper model can become more expensive when it needs repeated retries, additional verification calls, larger prompts, or human review. The supplied data does not measure task success, retry frequency, tool-call accuracy, or tokens required to reach an accepted answer. Those missing variables prevent a full cost-per-success comparison. A developer should therefore compare completed business outcomes, not only price per token.
MiMo-V2.5 is financially attractive for high-volume workloads with predictable prompts and tolerant quality thresholds. It is also a sensible first candidate for background enrichment, document transformation, and internal automation, subject to availability checks. o3 can still be economically rational for narrow tasks where its math result of 88.3 prevents expensive downstream correction. That conclusion is conditional because the research does not provide matched task-level accuracy or remediation costs.
The pricing evidence has a second limitation. The supplied research says the current OpenAI pricing page does not list o3, even though the data snapshot includes o3 prices. Developers should confirm whether the snapshot price reflects a currently callable product, a historical record, or another access path. MiMo-V2.5 has an even larger verification gap because the research provides no official pricing source.
MiMo-V2.5 leads on 3 of 3 metrics
MiMo-V2.5 should be the first model tested for general, cost-sensitive developer workloads, while o3 should be reserved for speed-sensitive or math-heavy paths. This recommendation follows the measured trade-off, not a claim that either model is universally superior.
Choose MiMo-V2.5 when your workload has high request volume, strict token budgets, broad task variety, or a need to optimize background processing costs. Its 37.2 intelligence index leads the available general comparison, and its $0.175 blended price makes experimentation less expensive. The missing official documentation means the implementation team must verify endpoint stability, context behavior, output limits, and operational support before committing.
Choose o3 when faster output is visible to users or mathematical reasoning is central to the product. Its 128.056 median output speed leads the measured result, and its 88.3 math index is the only supplied math score. The current documentation evidence is not sufficient to confirm that o3 remains directly available. OpenAI's model directory does not list o3 in the supplied research, and OpenAI's pricing page does not list a current o3 price.
Do not make a final coding decision from this snapshot. MiMo-V2.5 has a 56.8 coding index, but o3 has no supplied coding score. Run the same repository tasks, tool calls, structured-output checks, and retry policy against both models. Record success rate, accepted-answer cost, first-token timing, total completion time, and failure recovery. The supplied materials do not provide those measurements, so a local bake-off is necessary.
MiMo-V2.5 requires stronger availability and reliability verification before production adoption, despite its better measured value profile. The supplied research gives no official documentation, stable alias, context-window value, output limit, or community evidence for MiMo-V2.5. o3 has official reference pages, but those pages do not establish current o3 availability or pricing in the supplied material.
The unresolved questions are operational rather than cosmetic. Developers need to confirm whether the model can be called through the intended API, whether the measured prices are current, how long prompts can be, and how the model behaves under the application's concurrency and retry policy. None of those answers can be inferred safely from the benchmark snapshot.
MiMo-V2.5 is the better default for cost-sensitive general workloads because it scores 37.2 versus o3 at 30.4 on the supplied intelligence index and costs $0.175 versus $3.5 per 1M blended tokens. However, o3 is faster and has the only supplied math score, 88.3, so task requirements can reverse the choice.
MiMo-V2.5 is cheaper on every supplied token-price measure, with $0.14 input, $0.28 output, and $0.175 blended pricing per 1M tokens. The result may change at the system level if MiMo-V2.5 requires more retries, verification calls, or manual correction, none of which the supplied research measures.
o3 is faster after generation begins, with 128.056 median output tokens per second versus 73.585 for MiMo-V2.5. Both models show 0.3 seconds of measured latency, so the supplied evidence does not prove that o3 produces the first visible token sooner.
The supplied evidence cannot identify a coding winner because MiMo-V2.5 has a 56.8 coding index while o3 has no coding value. Developers should run matched repository tasks and measure accepted solutions, tool-call reliability, retries, and total cost before selecting either model for software engineering.
The supplied research cannot confirm current direct o3 access because OpenAI's current model directory does not list o3 in the referenced material. Developers should verify availability, aliases, endpoints, and pricing directly before implementation, since the benchmark snapshot includes o3 data but the current product pages do not provide those details.
MiMo-V2.5's biggest risk is insufficient product-status evidence, not its measured benchmark profile. The supplied research contains no verified official documentation, pricing page, stable alias, context-window value, output limit, or community testing, so deployment readiness remains unproven.