
Time to First Token · MiMo-V2-Pro
0ms
Time to First Token · o3
7185ms
Deep dive into reasoning, benchmarks, and latency insights.
The current catalog does not contain complete performance evidence for both models, so this page does not declare an overall winner. Use the available fields as comparison signals and validate the models on your own workload.
Key decision metrics at a glance.
| Model | Metric | Value | Unit | Source / snapshot |
|---|---|---|---|---|
| MiMo-V2-Pro | Reasoning | 6.0 | benchmark or capability score | Artificial Analysis · current catalog |
| o3 | Reasoning | 9.0 | benchmark or capability score | Artificial Analysis · current catalog |
| MiMo-V2-Pro | Coding | 6.0 | benchmark or capability score | Artificial Analysis · current catalog |
| o3 | Coding | 6.0 | benchmark or capability score | Artificial Analysis · current catalog |
| MiMo-V2-Pro | Multimodal | 3.0 | benchmark or capability score | Artificial Analysis · current catalog |
| o3 | Multimodal | 3.0 | benchmark or capability score | Artificial Analysis · current catalog |
| MiMo-V2-Pro | Long Context | 5.0 | benchmark or capability score | Artificial Analysis · current catalog |
| o3 | Long Context | 4.0 | benchmark or capability score | Artificial Analysis · current catalog |
| MiMo-V2-Pro | Blended Price / 1M tokens | $0 | USD per 1M tokens | Artificial Analysis · current catalog |
| o3 | Blended Price / 1M tokens | $3.5 | USD per 1M tokens | Artificial Analysis · current catalog |
| MiMo-V2-Pro | P95 Latency | — | milliseconds | Artificial Analysis · current catalog |
| o3 | P95 Latency | — | milliseconds | Artificial Analysis · current catalog |
| MiMo-V2-Pro | Tokens per second | 0 | tokens per second | Artificial Analysis · current catalog |
| o3 | Tokens per second | 119.185 | tokens per second | Artificial Analysis · current catalog |
Data provided by Artificial Analysis; live values use the current catalog.
This radar chart visually maps the core capabilities (reasoning, coding, math proxy, multimodal, long context) of `MiMo-V2-Pro` vs `o3`.
This grouped bar chart provides a side-by-side comparison for each benchmark metric.
Lower time to first token is better; higher tokens per second is better.
Compare input and output pricing in USD per 1M tokens.
MiMo-V2-Pro$0
o3$4
MiMo-V2-Pro costs $4 less per run
This article is a dated snapshot published on 2026-08-07. Live cards above use the current catalog; missing live fields are not inferred.
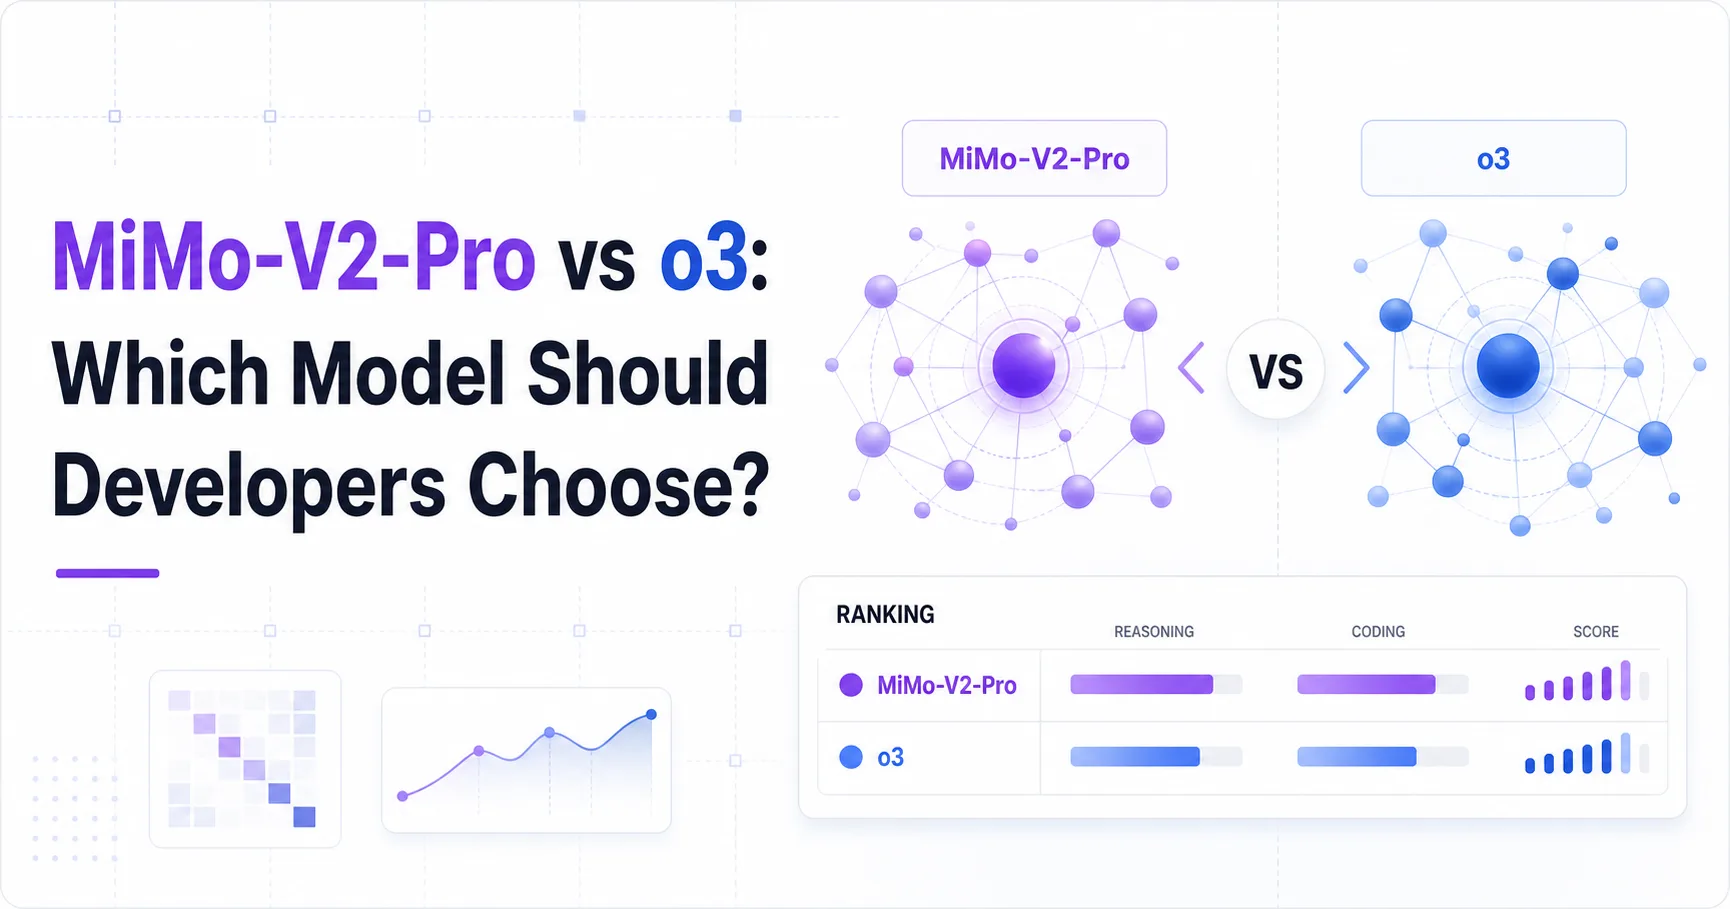
MiMo-V2-Pro leads the measured general intelligence comparison, while o3 is the safer documented choice for production planning.
The data brief gives MiMo-V2-Pro an Artificial Analysis Intelligence Index score of 40.3, compared with 30.4 for o3. That advantage does not establish a universal win across coding, reasoning, or agent workflows because the supplied data does not include a complete task-level benchmark matrix. The same brief reports a 0.3-second latency for both models, while only o3 has a reported median output speed of 128.056 tokens per second. Artificial Analysis
The selection problem is therefore asymmetric. MiMo-V2-Pro has the stronger reported aggregate intelligence score, but the research brief found no verifiable official product page, API documentation, pricing page, or community testing for it. o3 has the weaker aggregate score in this dataset, yet its public status can be checked against OpenAI's current documentation, which does not list the model in the current catalog. OpenAI's model catalog
For a developer making a deployable choice today, measured capability and operational confidence must be treated as separate decision criteria.
MiMo-V2-Pro is the measured capability winner, but o3 offers the clearer economic and operational case.
MiMo-V2-Pro's Intelligence Index result is 40.3, which is 9.899999999999999 points above o3's 30.4 in the supplied snapshot. That difference is large enough to justify a controlled evaluation if the workload rewards the capabilities represented by that index. It is not enough to predict success for a specific codebase, tool-use loop, or production agent without task-level tests. Artificial Analysis
O3 has a reported Math Index score of 88.3, while MiMo-V2-Pro has no corresponding value in the data brief. This is not evidence that o3 is better at all reasoning tasks. It does show that o3 has at least one measured strength that MiMo-V2-Pro cannot be compared against using the supplied snapshot.
The commercial gap is clearer. O3 costs $3.5 per 1M blended tokens, compared with $15 for MiMo-V2-Pro. Its listed input price is $2 per 1M tokens and its output price is $8, versus $10 and $30 for MiMo-V2-Pro. These values make o3 the default for high-volume workloads, unless MiMo-V2-Pro's task success rate reduces retries, human review, or downstream processing enough to offset the price difference. Artificial Analysis
The main unresolved question is access. The supplied research found no verified public availability information for MiMo-V2-Pro. OpenAI's current model catalog and pricing page also do not currently list o3, so neither model receives a clean availability verdict from the research materials. OpenAI's model catalog OpenAI API pricing
MiMo-V2-Pro's higher Intelligence Index makes it the better first candidate for difficult tasks, but the evidence does not prove broader task superiority.
A score of 40.3 for MiMo-V2-Pro versus 30.4 for o3 suggests a meaningful difference in the benchmark's aggregate capability measure. In real development work, that kind of gap could matter for tasks that require multi-step reasoning, ambiguous requirement interpretation, or sustained problem decomposition. The supplied materials do not identify the index's exact task mix, so developers should avoid translating the score directly into code quality, defect rates, or successful tool calls. Artificial Analysis
O3's Math Index score of 88.3 gives it a distinct measured signal for mathematical reasoning. MiMo-V2-Pro has no Math Index value in the snapshot, so the comparison is incomplete rather than unfavorable to either model. A team choosing for symbolic reasoning, quantitative analysis, or algorithm design should test both models on representative prompts before treating the aggregate intelligence result as decisive.
Speed also needs careful interpretation. O3 has a reported median output speed of 128.056 tokens per second, while MiMo-V2-Pro has no reported value. That means the dataset supports a speed statement for o3, not a verified speed ranking. Both models show 0.3 seconds of latency in the snapshot. Latency and generation speed measure different parts of the user experience, so the equal latency value does not mean equal time to produce a long answer. Artificial Analysis
For interactive coding assistants, the missing MiMo-V2-Pro speed value is a practical gap. A model can appear capable in offline evaluation yet feel slow in an editor if it generates long plans or waits during tool orchestration. For batch code review, speed may matter less than first-pass accuracy. For agents, tool-call reliability, recovery behavior, and context handling are more important than a single aggregate score, but the supplied research contains no verified evidence for those dimensions.
The most useful performance test is a small bake-off using the team's own repository, issue descriptions, test suite, and tool interface. The supplied research does not provide enough evidence to predict which model will produce fewer regressions or require less supervision.
O3 is the clear price winner, and MiMo-V2-Pro must deliver materially better task outcomes to justify its higher token cost.
The blended price is $3.5 per 1M tokens for o3 and $15 for MiMo-V2-Pro. O3 is also cheaper on both sides of the token split, at $2 per 1M input tokens and $8 per 1M output tokens, compared with $10 and $30 for MiMo-V2-Pro. These prices make o3 the natural starting point for applications with large prompts, frequent completions, or uncertain usage growth. Artificial Analysis
The charted prices do not reveal the full cost of a workflow. MiMo-V2-Pro could still be cheaper at the application level if its higher measured intelligence score leads to fewer retries, shorter prompts, fewer validation calls, or less human correction. Conversely, o3's lower token rate could become more expensive if a lower task success rate forces repeated calls or additional review. The research brief contains no verified retry, success-rate, or human-review data, so this break-even question remains unanswered.
Output-heavy workloads face the strongest price pressure. MiMo-V2-Pro's output price is $30 per 1M tokens, while o3's is $8. Long explanations, generated test files, repository-wide patches, and agent traces can therefore magnify the difference even when input volume is modest. Input-heavy workloads also favor o3 because its input price is $2 versus $10 per 1M tokens.
Teams should compare cost per accepted result rather than cost per raw token. That requires logging request tokens, output tokens, retries, tool calls, review time, and acceptance criteria for a fixed task set. The current materials do not establish whether either model supports stable aliases, current API access, or the pricing modes a production buyer might need. OpenAI's pricing page does not list o3 in the supplied research, and no verified MiMo-V2-Pro pricing page was found. OpenAI API pricing OpenAI's model catalog
If budget predictability is the primary constraint, o3 has the stronger case from the available numbers. If quality is the constraint, MiMo-V2-Pro deserves a measured pilot rather than an automatic production commitment.
MiMo-V2-Pro leads on 3 of 3 metrics
O3 is the default recommendation for production planning, while MiMo-V2-Pro is the higher-upside option for a verified capability trial.
Choose o3 first for high-volume code assistance, automated review, batch transformations, and applications where token economics must be easy to model. Its $3.5 blended price and reported 128.056 median output tokens per second provide a clearer starting point for capacity and cost experiments. Its Math Index value of 88.3 is also relevant for teams whose workloads include quantitative reasoning. Artificial Analysis
Choose MiMo-V2-Pro for evaluation when your work contains difficult, ambiguous, or multi-step reasoning and the Intelligence Index result of 40.3 reflects the capability you need. The model's advantage over o3's 30.4 is the strongest positive signal in the data brief. Treat it as a hypothesis for your workload, not as proof that it will write better code or operate tools more reliably. Artificial Analysis
Do not make either model the sole production dependency until access is verified. The MiMo-V2-Pro research found no reliable official product, API, pricing, or community source. The current OpenAI model catalog does not list o3, and the current pricing page does not list o3 pricing. Those findings create an availability risk for both options, even though the data brief contains prices for comparison. OpenAI's model catalog OpenAI API pricing
A sensible decision path is to run the same task set against both models, record accepted outputs and retries, then verify endpoint access, version naming, limits, and billing terms. The evidence is insufficient to select MiMo-V2-Pro solely on its aggregate score, and it is insufficient to select o3 solely on its lower price.
The final choice should follow the dominant failure cost. Pick o3 when repeated inference is affordable but token volume is large. Pick MiMo-V2-Pro when a successful first attempt is substantially more valuable and a controlled access path can be confirmed.
MiMo-V2-Pro requires the largest verification effort before adoption because the supplied research found no reliable public product evidence.
Developers should confirm endpoint availability, model identifiers, context limits, output limits, supported parameters, billing terms, and version stability for both models. The supplied research does not answer those questions for MiMo-V2-Pro, and the current OpenAI documentation provided for this comparison does not answer them for o3. OpenAI's model catalog OpenAI API pricing
The data brief is useful for prioritizing tests, not for replacing them. It provides aggregate scores, prices, latency, and one output-speed value, but it does not provide the workload-specific evidence needed to forecast code acceptance, agent completion, or operational reliability. Artificial Analysis
MiMo-V2-Pro is better on the supplied Artificial Analysis Intelligence Index, scoring 40.3 versus 30.4, but the evidence is insufficient to prove better coding, tool use, or production reliability.
O3 is cheaper, costing $3.5 per 1M blended tokens versus $15 for MiMo-V2-Pro, with lower listed input and output prices as well.
O3 is the only model with a reported median output speed, at 128.056 tokens per second, while both models have a reported latency of 0.3 seconds.
Neither model should be deployed without access verification because the research found no reliable MiMo-V2-Pro product evidence and the current OpenAI catalog does not list o3.
O3 has a measured Math Index value of 88.3, while MiMo-V2-Pro has no corresponding value in the supplied snapshot, so the comparison is incomplete.