
Time to First Token · o3
7185ms
Time to First Token · Qwen3.6 Max Preview
0ms
Deep dive into reasoning, benchmarks, and latency insights.
The current catalog does not contain complete performance evidence for both models, so this page does not declare an overall winner. Use the available fields as comparison signals and validate the models on your own workload.
Key decision metrics at a glance.
| Model | Metric | Value | Unit | Source / snapshot |
|---|---|---|---|---|
| o3 | Reasoning | 9.0 | benchmark or capability score | Artificial Analysis · current catalog |
| Qwen3.6 Max Preview | Reasoning | 6.0 | benchmark or capability score | Artificial Analysis · current catalog |
| o3 | Coding | 6.0 | benchmark or capability score | Artificial Analysis · current catalog |
| Qwen3.6 Max Preview | Coding | 6.0 | benchmark or capability score | Artificial Analysis · current catalog |
| o3 | Multimodal | 3.0 | benchmark or capability score | Artificial Analysis · current catalog |
| Qwen3.6 Max Preview | Multimodal | 3.0 | benchmark or capability score | Artificial Analysis · current catalog |
| o3 | Long Context | 4.0 | benchmark or capability score | Artificial Analysis · current catalog |
| Qwen3.6 Max Preview | Long Context | 5.0 | benchmark or capability score | Artificial Analysis · current catalog |
| o3 | Blended Price / 1M tokens | $3.5 | USD per 1M tokens | Artificial Analysis · current catalog |
| Qwen3.6 Max Preview | Blended Price / 1M tokens | $2.925 | USD per 1M tokens | Artificial Analysis · current catalog |
| o3 | P95 Latency | — | milliseconds | Artificial Analysis · current catalog |
| Qwen3.6 Max Preview | P95 Latency | — | milliseconds | Artificial Analysis · current catalog |
| o3 | Tokens per second | 119.185 | tokens per second | Artificial Analysis · current catalog |
| Qwen3.6 Max Preview | Tokens per second | 0 | tokens per second | Artificial Analysis · current catalog |
Data provided by Artificial Analysis; live values use the current catalog.
This radar chart visually maps the core capabilities (reasoning, coding, math proxy, multimodal, long context) of `o3` vs `Qwen3.6 Max Preview`.
This grouped bar chart provides a side-by-side comparison for each benchmark metric.
Lower time to first token is better; higher tokens per second is better.
Compare input and output pricing in USD per 1M tokens.
o3$4
Qwen3.6 Max Preview$3.25
Qwen3.6 Max Preview costs $0.75 less per run
This article is a dated snapshot published on 2026-08-07. Live cards above use the current catalog; missing live fields are not inferred.
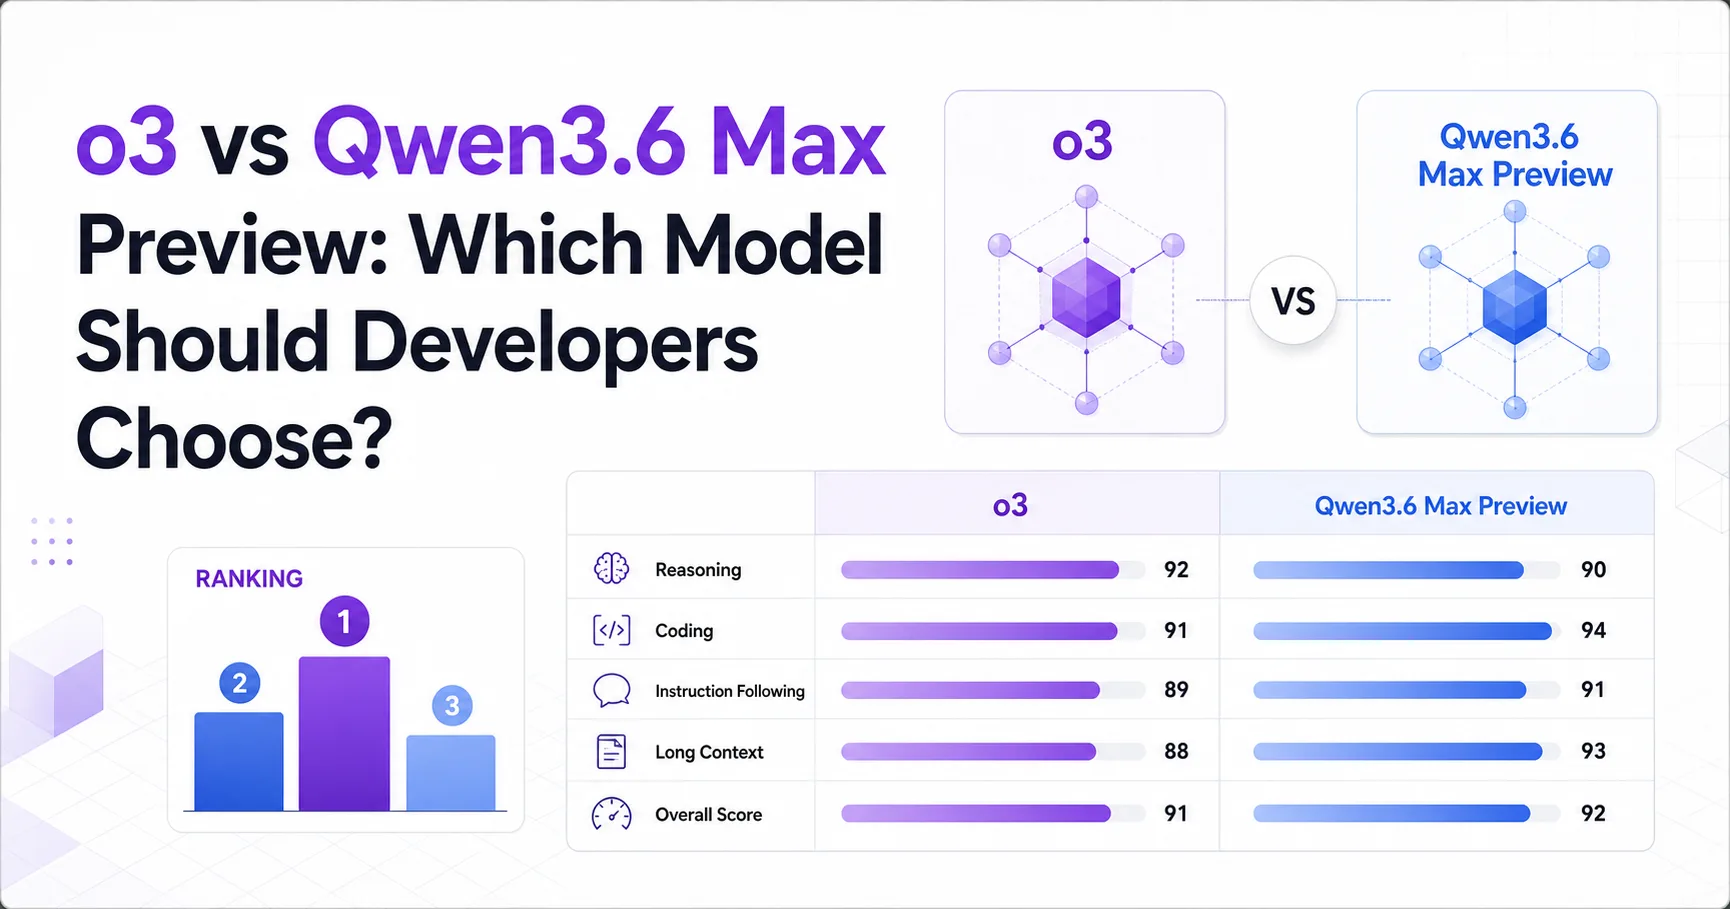
Qwen3.6 Max Preview leads the measured comparison on general intelligence and blended price, but o3 remains the only model with a reported mathematics score and output-speed result.\n\nThe available evidence supports a narrow conclusion, not a complete production verdict. Qwen3.6 Max Preview records an Artificial Analysis Intelligence Index score of 40, while o3 records 30.4. Qwen3.6 Max Preview also costs $2.925 per 1M blended tokens, compared with $3.5 for o3.\n\nThe comparison is less decisive for deployment. The supplied official material does not provide a verified Qwen3.6 Max Preview documentation or pricing source. OpenAI's current model directory does not list o3, and its pricing page does not provide a current o3 price. The numerical dataset therefore gives o3 a listed price and Qwen3.6 Max Preview a lower benchmark price, while the official-source review leaves current availability uncertain.\n\nData provided by https://artificialanalysis.ai/
Qwen3.6 Max Preview is the stronger measured default, while o3 is the more defensible specialist choice only when its mathematics result or measured speed matters.\n\nThe central difference is evidence coverage. Qwen3.6 Max Preview has the higher Intelligence Index score, 40 versus 30.4, and the lower blended price, $2.925 versus $3.5 per 1M tokens. Those results favor Qwen3.6 Max Preview for broad reasoning workloads where the benchmark and price data are the main selection signals.\n\n| Selection factor | o3 | Qwen3.6 Max Preview | What it means |\n|---|---:|---:|---|\n| Intelligence Index | 30.4 | 40 | Qwen3.6 Max Preview leads the available general score |\n| Mathematics Index | 88.3 | Not reported | o3 is the only model with a supplied mathematics measurement |\n| Median output speed | 128.056 tokens per second | Not reported | Speed leadership cannot be established across both models |\n| Latency | 0.3 seconds | 0.3 seconds | The supplied latency result is tied |\n| Blended price | $3.5 | $2.925 | Qwen3.6 Max Preview has the lower listed dataset price |\n\nThe official status is materially different. OpenAI's current model directory does not list o3 among the latest models described in the supplied brief. OpenAI's API pricing page does not list a current o3 price. No verifiable official source was supplied for Qwen3.6 Max Preview.\n\nThat means developers should treat the result as a measured comparison with an availability gap. The sources do not establish context windows, output limits, stable aliases, multimodal support, API endpoints, or replacement relationships for either model. Those omissions prevent a confident production recommendation based on capability alone.
Qwen3.6 Max Preview leads the available general-intelligence measurement, but o3 has the stronger evidence profile for mathematics and streaming output speed.\n\nThe Intelligence Index gap is large enough to matter for model screening. Qwen3.6 Max Preview scores 40, while o3 scores 30.4. In practical terms, that result makes Qwen3.6 Max Preview the first candidate to test for mixed reasoning, analysis, and instruction-following workloads. The benchmark does not prove that it will win every developer task, because the supplied materials do not identify the index's task mix, error distribution, or relationship to a specific application.\n\nThe mathematics evidence points in a different direction. o3 has a reported Mathematics Index score of 88.3, while no corresponding Qwen3.6 Max Preview value is supplied. This does not show that o3 is better at mathematics. It shows that o3 is the only model with a measured result in that category. A team choosing for mathematical reliability should run the same test set on both models before accepting the general-intelligence result as a proxy.\n\nOutput speed is similarly asymmetric. o3 has a reported median output rate of 128.056 tokens per second, while Qwen3.6 Max Preview has no supplied value. Developers building interactive coding or analysis workflows cannot infer a speed winner from the current record. Both models have a reported latency of 0.3 seconds, so the available latency result does not separate them.\n\nThe official evidence does not resolve these gaps. OpenAI's model documentation does not provide an o3 benchmark result in the supplied research. No official Qwen3.6 Max Preview source was supplied. The missing values are decision-relevant evidence gaps, not neutral details.
Qwen3.6 Max Preview has the lower supplied token price, but workload shape and deployment access could reverse the practical cost decision.\n\nThe dataset lists Qwen3.6 Max Preview at $2.925 per 1M blended tokens and o3 at $3.5. That makes Qwen3.6 Max Preview the cheaper option under the supplied 3-to-1 blended-token assumption. Its input price is also lower, at $1.3 versus $2, while the output prices are much closer, at $7.8 versus $8.\n\nThe practical implication is that Qwen3.6 Max Preview has its clearest cost advantage in input-heavy workloads. Large prompts, retrieved documents, code context, and repeated instructions can make the input-price difference more meaningful than the output-price difference. Output-heavy workloads have less room for savings because the listed output prices are close.\n\nThe conclusion can still flip. A lower token rate is not useful if the model cannot be called in the required region, lacks a stable endpoint, or requires a fallback to another provider. The supplied research does not verify a Qwen3.6 Max Preview model directory, stable alias, or current pricing page. OpenAI's pricing documentation also does not list a current o3 price, so the dataset price should not be treated as a confirmed present-day OpenAI tariff.\n\nTeams should compare the cost of accepted task outcomes, retries, fallback calls, and operational integration. The supplied evidence does not include quality-adjusted cost, failure rates, rate limits, or service terms. Those missing factors prevent a complete total-cost ranking.
Qwen3.6 Max Preview leads on 3 of 3 metrics
o3 is the safer experimental pick for mathematics-focused validation, while Qwen3.6 Max Preview is the better measured default for broad workloads and lower token spend.\n\nChoose Qwen3.6 Max Preview first when your application needs a general reasoning model and the available benchmark evidence is your primary filter. Its Intelligence Index score is 40, higher than o3's 30.4, and its blended price is $2.925 rather than $3.5 per 1M tokens. This combination makes it the natural candidate for an initial evaluation in assistants, document analysis, code explanation, and mixed knowledge-work prompts. The recommendation remains provisional because no verifiable official Qwen3.6 Max Preview source was supplied.\n\nChoose o3 for a controlled mathematics or high-throughput experiment when you need to test the reported Mathematics Index score of 88.3 or the reported median output speed of 128.056 tokens per second. Those values are useful reasons to include o3 in a bake-off. They are not enough to approve it for production, because the supplied OpenAI model directory does not list o3 and does not confirm a stable alias, endpoint, context window, or successor relationship.\n\nFor production selection, neither model has enough verified operational evidence in the supplied research. Both models show 0.3 seconds of latency, but Qwen3.6 Max Preview has no output-speed value and o3 has no verified current official listing. The final gate should therefore include live endpoint validation, representative prompts, structured output checks, rate-limit testing, failure handling, and region checks. The research brief does not provide results for those tests, so this article cannot claim a production winner.
Neither o3 nor Qwen3.6 Max Preview has enough supplied documentation to answer the operational questions that usually decide a production integration.\n\nThe research does not verify a context window, output limit, multimodal capability, stable model alias, API endpoint, rate limit, regional availability, or successor relationship for either model. It also does not provide reliable community reports, reproducible failure cases, or coding-experience studies.\n\nOpenAI's model directory is useful for checking current OpenAI model visibility, and OpenAI's pricing page is useful for checking listed billing modes. The supplied brief reports that neither page resolves the current o3 questions. No equivalent official source was supplied for Qwen3.6 Max Preview.\n\nDevelopers should read the benchmark comparison as a screening result. Before committing, validate both models against the application's own prompts and confirm that the selected endpoint is available under the intended account and deployment conditions.
Qwen3.6 Max Preview is the better measured overall choice because it scores 40 versus 30.4 on the Intelligence Index and costs $2.925 versus $3.5 per 1M blended tokens. The conclusion remains provisional because the supplied research lacks a verified official source for Qwen3.6 Max Preview and does not confirm either model's complete production capabilities.
The supplied evidence cannot establish that o3 is better for mathematics because o3 has a Mathematics Index score of 88.3, while Qwen3.6 Max Preview has no corresponding reported value. The result proves an evidence gap, not a comparative mathematics win. A matched evaluation is required before choosing o3 for mathematical workloads.
o3 is the only model with a reported median output speed, at 128.056 tokens per second, so it has the stronger speed signal. Qwen3.6 Max Preview has no supplied output-speed value, while both models show 0.3 seconds of latency. The available data therefore cannot prove an overall speed winner.
Qwen3.6 Max Preview has the lower supplied token cost, at $2.925 per 1M blended tokens compared with $3.5 for o3. Its input price is $1.3 versus $2, while output pricing is $7.8 versus $8. The practical winner can change if access, retries, fallbacks, or integration constraints add operational cost.
The supplied research does not support immediate production approval for either model because key operational facts remain unverified. OpenAI's current model directory does not list o3, and no official Qwen3.6 Max Preview source was supplied. Teams should first verify endpoints, aliases, limits, regional access, and application-specific quality.