
Time to First Token · Hy3
1831ms
Time to First Token · o3
7185ms
Deep dive into reasoning, benchmarks, and latency insights.
The current catalog does not contain complete performance evidence for both models, so this page does not declare an overall winner. Use the available fields as comparison signals and validate the models on your own workload.
Key decision metrics at a glance.
| Model | Metric | Value | Unit | Source / snapshot |
|---|---|---|---|---|
| Hy3 | Reasoning | 6.0 | benchmark or capability score | Artificial Analysis · current catalog |
| o3 | Reasoning | 9.0 | benchmark or capability score | Artificial Analysis · current catalog |
| Hy3 | Coding | 6.0 | benchmark or capability score | Artificial Analysis · current catalog |
| o3 | Coding | 6.0 | benchmark or capability score | Artificial Analysis · current catalog |
| Hy3 | Multimodal | 4.0 | benchmark or capability score | Artificial Analysis · current catalog |
| o3 | Multimodal | 3.0 | benchmark or capability score | Artificial Analysis · current catalog |
| Hy3 | Long Context | 5.0 | benchmark or capability score | Artificial Analysis · current catalog |
| o3 | Long Context | 4.0 | benchmark or capability score | Artificial Analysis · current catalog |
| Hy3 | Blended Price / 1M tokens | $0.241 | USD per 1M tokens | Artificial Analysis · current catalog |
| o3 | Blended Price / 1M tokens | $3.5 | USD per 1M tokens | Artificial Analysis · current catalog |
| Hy3 | P95 Latency | — | milliseconds | Artificial Analysis · current catalog |
| o3 | P95 Latency | — | milliseconds | Artificial Analysis · current catalog |
| Hy3 | Tokens per second | 74.815 | tokens per second | Artificial Analysis · current catalog |
| o3 | Tokens per second | 119.185 | tokens per second | Artificial Analysis · current catalog |
Data provided by Artificial Analysis; live values use the current catalog.
This radar chart visually maps the core capabilities (reasoning, coding, math proxy, multimodal, long context) of `Hy3` vs `o3`.
This grouped bar chart provides a side-by-side comparison for each benchmark metric.
Lower time to first token is better; higher tokens per second is better.
Compare input and output pricing in USD per 1M tokens.
Hy3$0.275
o3$4
Hy3 costs $3.725 less per run
This article is a dated snapshot published on 2026-08-07. Live cards above use the current catalog; missing live fields are not inferred.
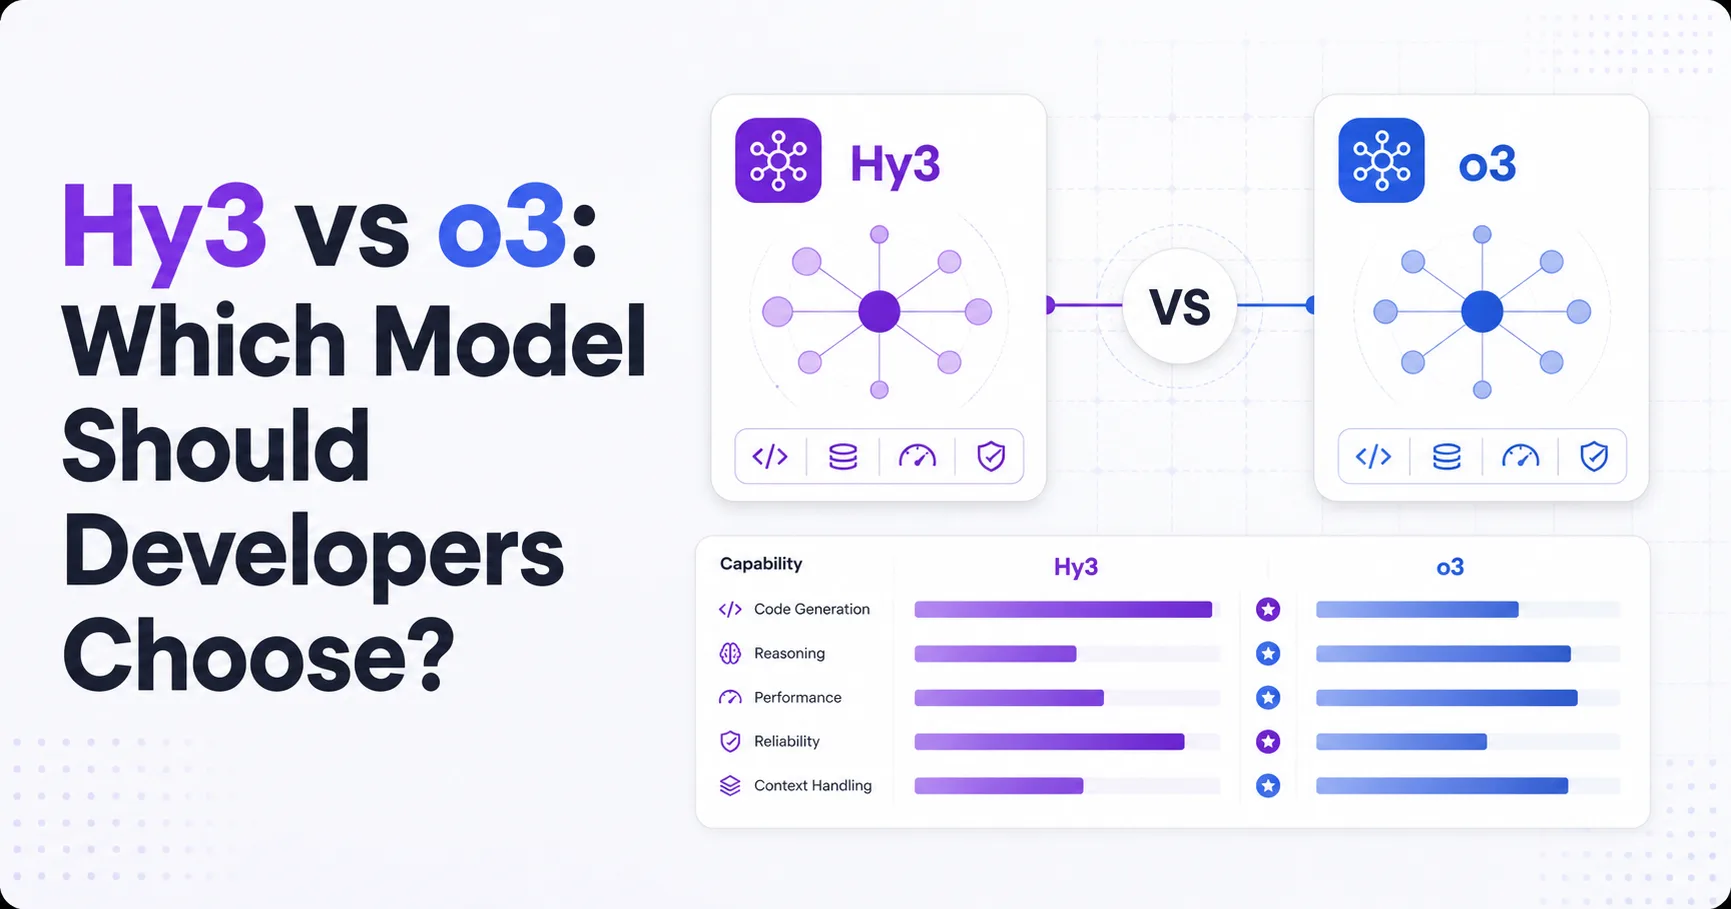
Hy3 is the practical default for cost-sensitive developer workloads, while o3 remains the faster option with stronger evidence for mathematical reasoning.
The available data gives Hy3 a blended price of $0.24125 per 1M tokens, compared with $3.5 for o3. Hy3 also records an Artificial Analysis Intelligence Index of 41.2, ahead of o3 at 30.4. Those figures favor Hy3 for broad value and general task coverage.
o3 produces output at a median 128.056 tokens per second, compared with 71.711 for Hy3. Both models show latency of 0.3 seconds, so the practical distinction is sustained generation speed rather than initial response delay.
The comparison has an important evidence gap. The supplied materials do not provide a directly comparable Hy3 mathematics score, while o3 has a Math Index of 88.3. The supplied materials also do not provide a Hy3 coding score for o3, although Hy3 has a Coding Index of 58.8.
OpenAI’s current model directory does not list o3 among the current models shown in the supplied research. Developers should therefore treat o3’s availability, alias stability, and replacement status as unresolved until their own account and endpoint checks confirm them.
Hy3 leads the available broad-value comparison, but o3 has the clearest measured advantage in output speed and mathematics.
Hy3 was released on 2026-07-06 in the supplied data snapshot, while o3 was released on 2025-04-16. Release dates alone do not establish quality, support, or suitability. They do show that the two entries represent different points in the model market, so a simple assumption that the newer model is automatically better would be unsafe.
The strongest available signal for Hy3 is its Artificial Analysis Intelligence Index of 41.2. The corresponding o3 score is 30.4. This favors Hy3 on the broad index included in the brief, but the brief does not define the index methodology in enough detail to predict performance on a specific application.
The strongest available signal for o3 is its Math Index of 88.3. No comparable Hy3 math value is supplied, so the result cannot be interpreted as a measured head-to-head win. The same limitation applies to coding in the opposite direction. Hy3 has a Coding Index of 58.8, but no o3 coding value appears in the data brief.
The official evidence is also asymmetric. OpenAI’s current model documentation lists newer GPT-5.6 models but does not list o3 in the supplied research. The research found no official o3 benchmark, stable alias, API endpoint, context window, output limit, or multimodal specification. Hy3 has no official or community source in the supplied materials. That makes both operational verification and capability claims incomplete.
o3 is the better choice when faster streamed generation has more value than the available broad intelligence signal.
The output-speed difference is operationally meaningful. o3 reaches a median 128.056 output tokens per second, while Hy3 reaches 71.711. In an interactive coding assistant, this can make long explanations, generated patches, or multi-step answers feel more immediate after generation begins. The benefit is most visible when responses are long enough for sustained decoding to dominate the user’s wait.
The latency result does not separate the models. Both are listed at 0.3 seconds. A team should therefore avoid describing o3 as categorically more responsive. The evidence supports faster token production, not a lower time to first response.
Capability conclusions require more caution. Hy3 leads the supplied Artificial Analysis Intelligence Index, with 41.2 versus o3’s 30.4. That result may support Hy3 for general-purpose tasks represented by the index, but it does not prove better code repair, tool use, planning, or production reliability. The brief provides no task-level breakdown that would connect the index to a developer workflow.
o3’s Math Index is 88.3, but Hy3 has no supplied mathematics score. Hy3’s Coding Index is 58.8, but o3 has no supplied coding score. These missing cells prevent a complete capability ranking. Developers choosing for code generation, mathematical proof, or agentic execution should run matched prompts and evaluate correctness, retries, and tool-call behavior before committing.
Hy3 is the clear price leader, but o3 can still be economically rational when faster output reduces user waiting or infrastructure utilization.
Hy3 costs $0.24125 per 1M blended tokens, compared with $3.5 for o3. Its listed input price is $0.136 per 1M tokens and its output price is $0.557. o3 is listed at $2 for input and $8 for output. The gap is especially important for applications that generate substantial output, such as code explanations, test plans, migration drafts, or long structured responses.
The blended figure uses a 3-to-1 weighting in the supplied data. That means it is a useful planning reference, not a universal invoice estimate. A workload with unusually high output consumption will feel the output-rate gap more strongly. A retrieval-heavy workload with short answers may behave differently, especially if prompt tokens dominate.
Cheaper does not automatically mean lower total cost. If Hy3’s slower output requires more concurrent sessions, longer user occupancy, more queue capacity, or additional retries, the token saving may be partly offset. The supplied materials do not provide throughput limits, concurrency behavior, failure rates, or quality-adjusted cost. Those are evidence gaps, not reasons to invent a winner.
OpenAI’s pricing documentation does not list o3 in the supplied research. The data brief still provides o3 price values, so teams should reconcile the benchmark snapshot with their actual account pricing before forecasting spend.
Hy3 leads on 3 of 3 metrics
Hy3 should be the first candidate for high-volume general development workflows, while o3 should be validated for speed-sensitive or math-heavy tasks.
Choose Hy3 first when the application serves many requests, output volume is meaningful, and the available general intelligence score is a useful proxy for the task. Its $0.24125 blended price gives it a much wider budget margin than o3. That margin can fund evaluation traffic, retries, observability, or a second-model fallback. Hy3 is also the only model in the supplied comparison with a Coding Index of 58.8, although the missing o3 coding value prevents a direct ranking.
Choose o3 first when users strongly value fast streamed output or when mathematics is central to the product. Its 128.056 median output tokens per second is materially higher than Hy3’s 71.711. Its Math Index of 88.3 is also a positive signal for quantitative workloads. Neither result proves production success, because the supplied research contains no task-specific error rates, benchmark methodology details, or community-verified failure cases.
Use a staged decision for ambiguous workloads. Start with a matched evaluation set that reflects real prompts, expected answer lengths, tool calls, and acceptance criteria. Measure correctness, edit distance for code changes, latency to first token, full completion time, retry frequency, and cost per accepted result. The available data reports latency as 0.3 seconds for both models, but it does not provide the other operational measures.
Before selecting o3 for a new production integration, confirm that the model is callable in the intended account and that its alias and endpoint are stable. The supplied OpenAI model directory does not list o3, and the research does not identify a formal successor or retirement status. Before selecting Hy3, verify provider ownership, terms, retention behavior, context limits, and support, because the supplied research contains no official Hy3 documentation.
Hy3 is the safer initial shortlist for most cost-sensitive teams, but unresolved operational evidence should shape the validation plan.
The comparison is useful for narrowing candidates, not for replacing an application-specific test. The supplied brief contains enough data to compare price, median output speed, latency, and selected index values. It does not contain enough information to confirm context windows, output limits, API stability, multimodal behavior, failure modes, or quality-adjusted cost.
That distinction matters because model selection is a systems decision. A lower token price can lose its advantage if the model requires more retries. A higher score can be irrelevant if the model cannot be called reliably. A faster decoder can have limited user impact if time to first token or tool execution dominates the request.
Teams should document these unknowns as explicit launch gates. The current official OpenAI pages supplied in the research do not resolve o3 availability or pricing, while no source is supplied for Hy3. The final decision should therefore combine the snapshot values with direct endpoint checks and a representative evaluation set.
Hy3 is the stronger default for cost-sensitive general workloads because its Artificial Analysis Intelligence Index is 41.2 and its blended price is $0.24125, but o3 remains faster and has a Math Index of 88.3.
Hy3 is cheaper at $0.24125 per 1M blended tokens versus $3.5 for o3, although the real advantage depends on output share, retries, concurrency, and the number of responses that users accept.
o3 generates tokens faster, with a median output rate of 128.056 tokens per second compared with Hy3 at 71.711, while both models have the same listed latency of 0.3 seconds.
o3 is the better-supported mathematics candidate because its Math Index is 88.3, but the supplied data has no comparable Hy3 math score, so teams should validate accuracy on their own problems.
o3 should not be deployed solely from this comparison because the supplied OpenAI model directory does not list it and the research does not confirm a stable alias, endpoint, availability status, or replacement path.